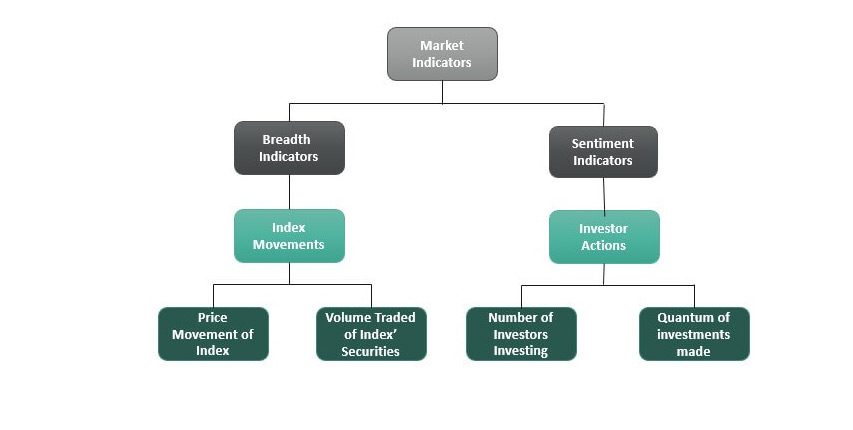
The stock market can be a volatile and unpredictable environment, which is why it is important for investors to use different types of indicators to make informed decisions. These indicators can help investors understand the trends, patterns, and signals that the market is showing, and can help investors determine when to buy, sell, or hold their investments.
Here are some of the most common types of indicators in the stock market and how they are used:
Moving Averages
A moving average is the average price of a stock over a certain period of time. Typically, investors use 50-day, 100-day, and 200-day moving averages to analyze the performance of a stock. When the stock price is above the moving average, it is considered to be in an uptrend, and when it is below the moving average, it is considered to be in a downtrend.
Relative Strength Index (RSI)
The RSI is a momentum indicator that measures the strength of a stock’s price action. The RSI ranges from 0 to 100, and a reading above 70 is considered to be overbought, while a reading below 30 is considered to be oversold. When the RSI is overbought, it may indicate that the stock is due for a pullback, while an oversold reading may indicate that the stock is undervalued and may be a good buy opportunity.
Bollinger Bands
Bollinger Bands are a volatility indicator that measures the standard deviation of a stock’s price over a certain period of time. The bands consist of three lines – the middle line is a moving average, and the upper and lower bands are the standard deviations of the moving average. When the stock price is near the upper band, it may indicate that the stock is overbought, while when it is near the lower band, it may indicate that the stock is oversold.
Volume
Volume is a measure of the number of shares that are traded in a stock. High volume can indicate that there is a lot of interest in a stock, while low volume can indicate that there is little interest. High volume can also indicate that there is a lot of buying or selling pressure in a stock, which can be a signal for investors to take action.
Candlestick Charts
Candlestick charts are a type of chart that displays the price action of a stock over a certain period of time. Each candlestick represents a day of trading, and shows the opening price, closing price, high price, and low price of the stock. Candlestick charts can help investors understand the trends and patterns of a stock, and can be used to identify potential buy or sell signals.
These are just a few of the many types of indicators that investors can use to analyze the stock market. It is important to note that no single indicator can provide a complete picture of the market, and that investors should use a combination of indicators to make informed decisions.
In addition to using indicators, it is also important for investors to have a solid understanding of the underlying fundamentals of the companies they invest in. This includes factors such as the company’s financial performance, management team, industry trends, and competitive landscape.
In conclusion,
the stock market can be a complex and ever-changing environment, but by using different types of indicators and understanding the fundamentals of the companies they invest in, investors can make informed decisions and navigate the market with confidence.
Read More
What is the difference between a debit card and a credit card?

